







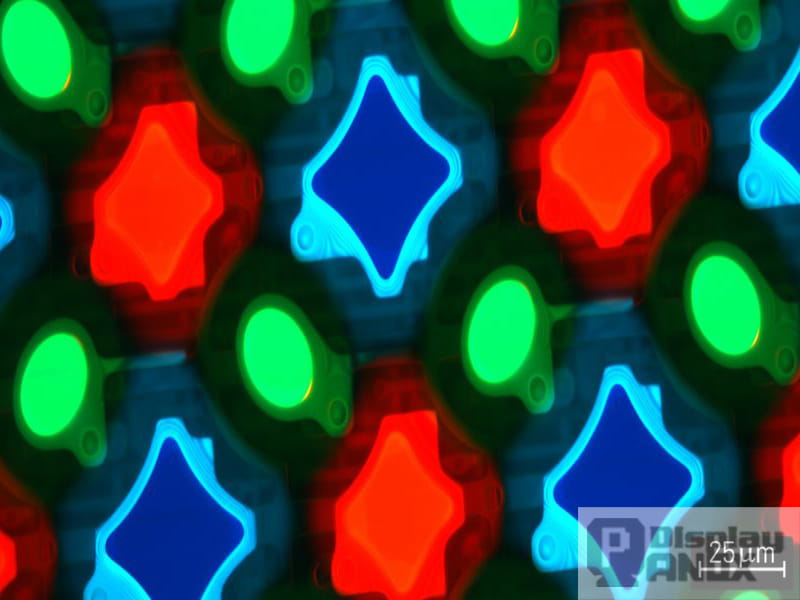
OLED displays are known for deep blacks, high contrast, wide viewing angles, fast response times, and thin form factors. These advantages have made OLED a core display technology for smartphones, wearables, automotive systems, industrial equipment, televisions, and near-eye devices. Yet one technical challenge continues to shape OLED design: the red, green, and blue subpixels do not age at the same rate.
This uneven aging affects more than overall brightness. It can change color balance, reduce display uniformity, and contribute to permanent OLED burn-in. In many RGB OLED structures, the blue subpixel is the most difficult color to stabilize because producing blue light requires higher-energy excited states and places greater stress on the organic emitting materials.
A 2022 study published in Displays examined this problem directly. Instead of measuring only the combined white output of an OLED module, the researchers developed an automated system that measured red, green, and blue subpixel degradation separately and at the same time. The results showed that, within the tested commercial OLED sample and operating range, blue subpixels had the fastest luminance decay and became the main limitation on OLED lifespan at high initial brightness.
OLED Lifespan Is a Subpixel-Level Problem
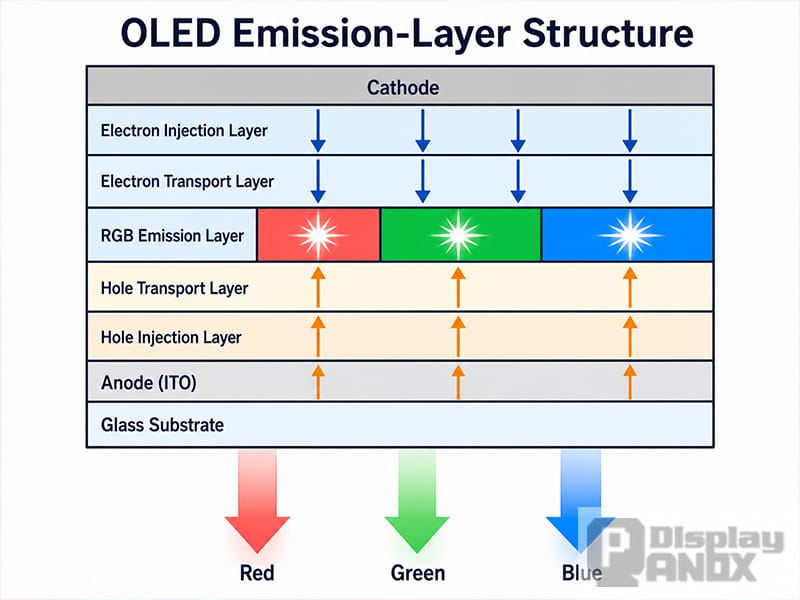
An OLED pixel does not emit light as a single, uniform source. A full-color RGB OLED display uses separate red, green, and blue subpixels, and each subpixel contains organic materials that emit light when current passes through them.
These materials gradually lose efficiency during operation. For the same electrical input, an aged subpixel produces less light than it did when new. If all subpixels aged at exactly the same rate, the panel would mainly become dimmer over time. In practice, the aging is uneven across colors and screen regions, so color shifts and visible image retention may develop before the entire panel reaches its nominal end of life.
Conventional OLED lifetime testing can hide this behavior. A luminance meter aimed at a white test pattern measures the combined output of the red, green, and blue channels. It can show that white luminance has fallen to 90% of its initial value, but it cannot identify which color caused the decline.
This limitation is especially important for high-resolution displays containing millions of subpixels. Differences in subpixel size, material deposition, local temperature, current density, and manufacturing uniformity can produce different aging behavior across the panel.
IEC 62341-5-3:2019 defines methods for measuring image sticking and the lifetime of OLED panels and modules. Its lifetime method mainly applies to the module as a whole. The research discussed here addressed the gap between module-level measurement and the actual degradation of individual RGB subpixels.
How the RGB OLED Subpixel Lifetime Test Worked
The researchers tested commercial OLED screens from the same batch of customized 6.2-inch smartphone displays. Their measurement system combined a spectrometer, a fiber-optic probe, a five-degree-of-freedom automatic mechanical platform, a computer, and a module signal generator.
The signal generator controlled the display and adjusted the driving current to create different initial luminance conditions. Three linear stepper-motor axes positioned the probe along the X, Y, and Z directions, while two rotary axes helped maintain accurate perpendicular alignment between the optical probe and the OLED surface.
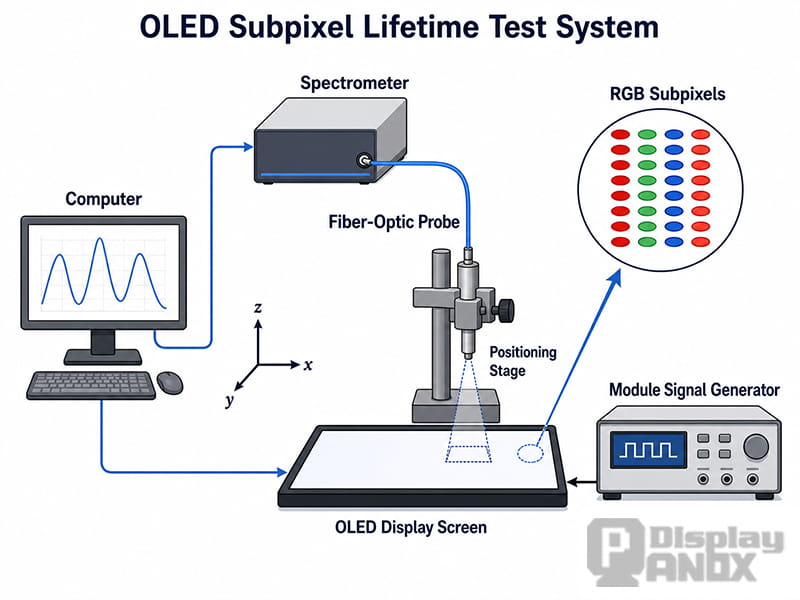
A G-code program controlled the platform and moved the probe automatically between selected measurement points. This made it possible to examine different areas of the screen and reduce the effect of manual alignment errors.
The key advantage came from spectral separation. Instead of treating the display output as mixed white light, the system divided the measured spectrum into three wavelength ranges:
Blue-light intensity was calculated from approximately 440 to 500 nm, green from 500 to 580 nm, and red from 580 to 660 nm. Integrating the spectral intensity within each range produced separate luminance-decay curves for the blue, green, and red subpixels.
As a result, one automated test could monitor all three color channels and compare their aging behavior under the same operating conditions.
Validating the Spectral Measurement Method
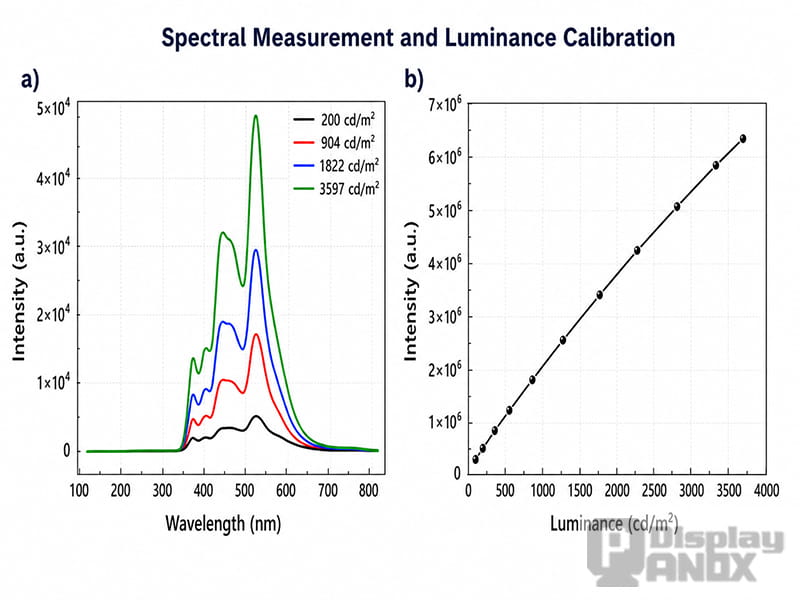
Before relying on spectral integration for lifetime prediction, the researchers verified that integrated optical intensity had a reliable relationship with measured luminance.
OLED spectra were collected at luminance levels of 200, 904, 1,822, and 3,597 cd/m². The curves showed the characteristic blue, green, and red emission regions of the OLED display. As the luminance increased, the spectral intensity rose while the general emission profile remained recognizable.
The researchers then integrated the spectrum across the selected wavelength ranges and compared the result with luminance values measured by a PR-655 reference spectroradiometer. The integrated spectral intensity and measured luminance followed an approximately linear relationship across the tested range.
This calibration was important because it demonstrated that spectral integration could serve as a practical substitute for a conventional luminance reading while preserving information about each color channel. The system could therefore track RGB subpixel aging without relying on three independent measurements or treating the display as a single white-light source.
What the Subpixel Aging Curves Revealed
The most important part of the study compared normalized luminance decay for blue, green, red, and combined white output. Four initial luminance conditions were shown in the aging curves: 1,740, 2,977, 5,024, and 6,666 cd/m².
Normalized luminance expresses the remaining output as a proportion of the initial value. A value of 1.0 represents the beginning of the test, while 0.9 means that the measured output has declined to 90% of its starting level.
At 1,740 cd/m², all three color channels aged relatively slowly. The blue, green, and red curves remained close to their initial values during the measured period, and the combined white output showed the least degradation of the four operating conditions.
At 2,977 and 5,024 cd/m², the behavior began to separate. Red and blue subpixel decay became more pronounced, while the green channel remained comparatively stable. This demonstrated that increasing brightness did not affect every organic emitter in the same way.
The largest difference appeared at 6,666 cd/m². Blue luminance dropped sharply, green degradation also increased, and the change in red was comparatively less dramatic. The combined white-light curve deteriorated accordingly.
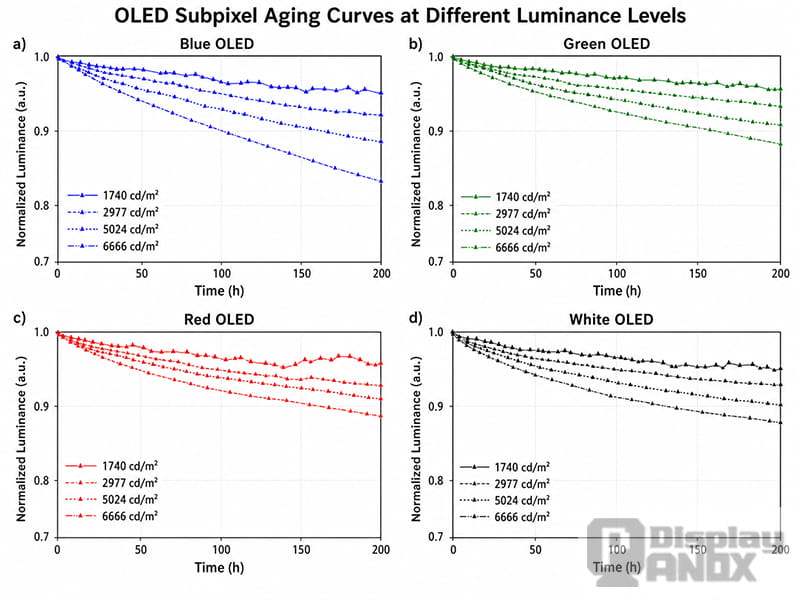
These results show why whole-screen luminance measurements are incomplete: combined white-light data record the overall decline, while separate RGB measurements identify the subpixel driving it. The white curve records the final result, but the individual RGB curves reveal the source of the decline. Under the highest tested luminance condition, rapid blue OLED degradation had the strongest influence on the overall OLED lifespan.
How Brightness Changes OLED Lifespan
OLED aging does not normally increase in direct proportion to brightness. Raising luminance requires greater electrical and optical stress, and the resulting increase in degradation can be nonlinear.
The researchers fitted the experimental results with a stretched-exponential, also described as an extended-exponential, decay model. This type of model is commonly used when several degradation processes operate together rather than at one fixed rate.
The fitted curves were used to estimate T90 and T50. T90 is the operating time required for luminance to fall to 90% of the initial value. T50 is the time required to reach 50%.
At an initial luminance of 1,740 cd/m², the modeled T90 reached approximately 1,500 hours. At 2,977 cd/m², the OLED required only about 400 hours to fall to 0.9 of its initial luminance. At 6,666 cd/m², the estimated T90 dropped to approximately 220 hours, while T50 was around 1,200 hours.
The comparison makes the brightness penalty clear. The highest-luminance condition did not simply age a little faster; it produced a much steeper decay curve and a substantial reduction in the time required to reach visible luminance loss.
These accelerated-test values should not be treated as universal consumer-display lifetime ratings. Actual OLED lifespan depends on panel architecture, materials, thermal conditions, compensation algorithms, brightness duty cycle, displayed content, and the definition used for end of life. The value of the experiment lies in the comparison between controlled conditions: higher initial luminance accelerated degradation, and the blue subpixel became the dominant bottleneck.
Why Do Blue OLED Subpixels Degrade Faster?
Blue light carries more photon energy than red or green light. Producing efficient blue emission therefore requires organic molecules and device structures that can manage higher-energy excited states while maintaining chemical stability.
This creates several connected problems. High-energy excitons can open degradation pathways that are less accessible in lower-energy red and green OLED materials. If excitons or electrical charges become concentrated within a narrow part of the emission layer, interactions such as triplet–triplet annihilation and triplet–polaron annihilation can generate additional energetic states, charge traps, and non-radiative defects.
Experimental research on blue OLED devices has also identified degradation near the interface between the emission layer and electron-transport layer, particularly where the exciton concentration is high. Other studies have shown that injected electrons can weaken molecular bonds and participate in irreversible reactions that reduce emission efficiency.
For this reason, blue OLED degradation cannot be attributed to one simple cause. Emitter stability, host material, charge balance, current density, emission-zone position, interfaces, temperature, and device architecture all influence the final lifetime.
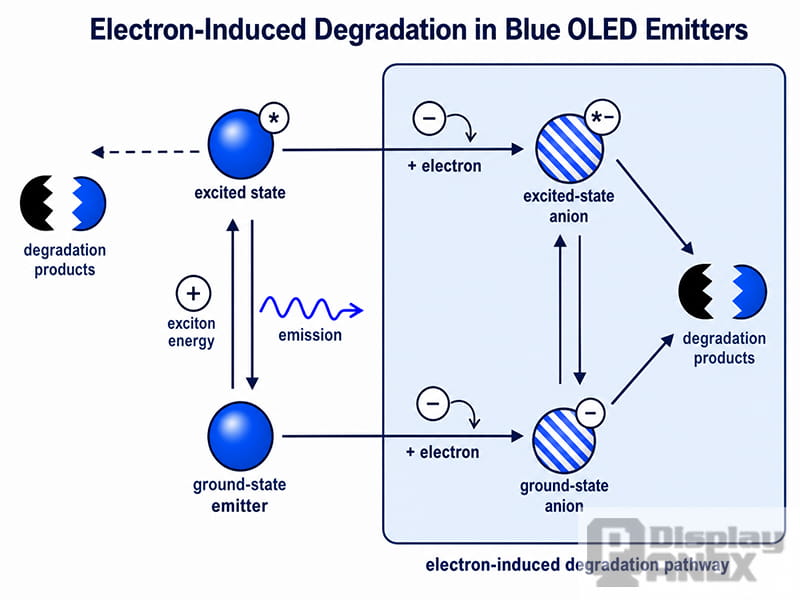
Modern OLED engineering addresses the problem through more stable emitters, improved host materials, better charge balance, larger or differently shaped blue subpixels, tandem emitting structures, thermal management, and pixel-level compensation. These advances have improved real-world reliability, but blue stability remains a central consideration in full-color OLED development.
The Relationship Between Blue Pixel Aging and OLED Burn-In
OLED aging and OLED burn-in are related, but they are not identical.
A panel can experience general aging when most of the screen operates at similar brightness for a long period. The result may be lower overall luminance or a gradual color shift. Burn-in occurs when particular screen regions age faster than surrounding regions, usually because they repeatedly display bright, static content.
Common examples include navigation bars, channel logos, dashboard symbols, game interfaces, status icons, and fixed industrial controls. The subpixels beneath these elements accumulate more operating stress. When the content changes, the unevenly aged area may remain visible as a faint image or color difference.
If blue subpixels age faster, a heavily used region may lose blue output more rapidly and shift toward warmer colors. However, the visible result depends on the content and panel architecture. A static red element mainly stresses red emission, while a bright white element drives several color channels at once. Some OLED structures may also show a different color-aging order because of their emitter stack, subpixel layout, color-conversion system, or compensation strategy.
Permanent burn-in should also be separated from temporary image retention. Temporary retention can fade after the display rests or runs a compensation cycle. Permanent burn-in is caused by irreversible differential aging and cannot be chemically restored by software. Compensation algorithms may reduce its visibility, but they cannot return degraded organic material to its original state.
A more detailed explanation of this distinction is available in Panox Display’s guide to OLED burn-in prevention.
What the Results Mean for OLED Product Design
The study shows why a single headline lifetime value is not enough for an OLED product. A display intended for video playback has a different aging profile from an automotive cluster, medical interface, industrial HMI, or digital sign that keeps bright symbols in fixed positions.
Lifetime planning should begin with the real application profile: typical and peak luminance, daily operating time, static-content duration, ambient temperature, color distribution, expected service life, and acceptable luminance or color change.
Brightness should be managed as an engineering parameter rather than a fixed marketing target. A display may be capable of very high peak luminance, but continuously operating near that level can shorten OLED lifespan. Adaptive brightness, automatic dimming, dark interface elements, sensible standby behavior, and careful thermal design can reduce current density and accumulated stress.
Static interface elements also need attention before production. Slight pixel movement, local brightness reduction, screen savers, content variation, and pixel-compensation routines can distribute wear more evenly. Further practical guidance appears in Panox Display’s discussion of how long OLED screens last before burn-in.
At Panox Display, panel selection is considered together with the complete duty profile. Resolution, brightness, operating environment, interface design, controller behavior, touch integration, and thermal conditions all influence whether an OLED module is suitable for a particular application. The objective is not simply to choose the brightest panel, but to balance optical performance with predictable long-term reliability.
Panox Display’s broader OLED display solutions cover panel selection and integration for different product categories. Applications exposed to heat, moisture, mechanical stress, or continuous operation also benefit from understanding why OLED displays can be fragile.
What This OLED Lifetime Study Does—and Does Not—Prove
The research provides strong evidence that subpixel-resolved measurement is more informative than a combined white-light lifetime test. It also demonstrates that blue subpixel decay made a major contribution to the aging of the tested commercial OLED displays.
The study does not establish one fixed lifetime for every OLED panel. It examined a particular batch of commercial RGB smartphone OLEDs under controlled and accelerated operating conditions. WOLED, QD-OLED, RGB OLED, Micro OLED, tandem OLED, and other architectures may use different materials, subpixel structures, driving schemes, and compensation methods.
The order and rate of red, green, and blue aging can therefore vary between products. Panel temperature, content pattern, current density, encapsulation quality, manufacturing variation, and firmware can also change the result.
The broader engineering lessons remain important: OLED degradation is color-dependent, high luminance accelerates aging, whole-module measurements can conceal the weakest subpixel, and blue-emitter stability continues to influence full-color OLED lifetime.
Final Takeaway: Blue Remains the Critical OLED Lifetime Challenge
OLED aging begins inside individual light-emitting materials, not at the screen level. A white-luminance measurement can show that a panel is becoming dimmer, but only subpixel-level analysis can reveal whether red, green, or blue is responsible.
The automated spectrometer platform used in this study separated the RGB spectrum, measured the three color channels simultaneously, and compared their decay at different initial luminance levels. Its results showed that high brightness sharply reduced OLED lifetime and that rapid blue-subpixel degradation became the main limitation under the most demanding condition.
For OEM display projects, the practical conclusion is straightforward: OLED lifespan must be evaluated against the actual brightness profile, interface content, thermal environment, and service requirements of the product. Separating RGB aging, controlling current density, reducing long-duration static content, and selecting appropriate compensation strategies can produce more reliable OLED systems without giving up the technology’s visual advantages.
Learn more: OLED Screen Lifespan Revealed: How Many Years Will It Last?
Frequently Asked Questions About OLED Subpixel Aging
Which OLED color degrades the fastest?
In the commercial RGB OLED sample examined in this study, the blue subpixel had the fastest decay within the tested range and contributed most strongly to overall aging at high luminance. The exact aging order can vary with panel architecture, materials, subpixel layout, and compensation technology.
Does higher brightness reduce OLED lifespan?
Yes. Higher luminance generally requires higher current density and increases electrical, thermal, and excitonic stress. In the study, increasing the initial luminance caused a sharp reduction in T90, especially when the blue channel began to degrade rapidly.
Is blue subpixel degradation the same as OLED burn-in?
No. Blue subpixel degradation is the loss of blue-emission efficiency over time. Burn-in is a visible pattern caused by uneven aging between screen regions. Faster blue aging can contribute to burn-in and color shift, but static content, brightness, temperature, and the use of all three color channels determine the final pattern.
Can permanent OLED burn-in be repaired?
Permanent burn-in represents irreversible material degradation. Pixel-refresh and compensation systems can reduce the visible difference by adjusting neighboring or affected pixels, but they cannot restore aged organic emitters to their original condition. Preventing uneven wear during product design and operation is more effective than attempting to correct it later.