







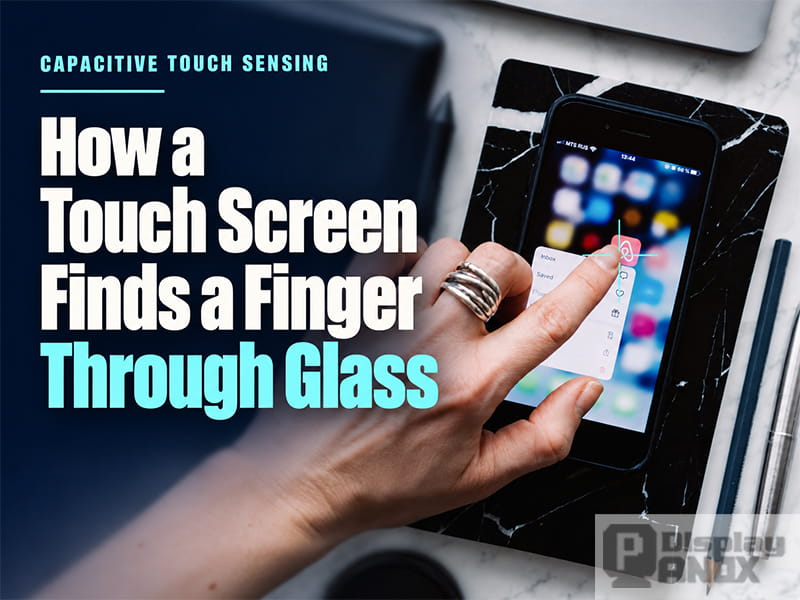
A finger lands near the edge of an icon and the phone opens the right app. The glass barely moves. Beneath it, the finger changes the electric field around several sensing electrodes, and the touch screen controller picks up the resulting change in capacitance. The position of the finger has to be worked out from those readings, even when it lands between two sensing points.
That is the job of capacitive touch sensing. A phone, a handheld instrument, and an industrial control panel can all use this principle. What varies is the strength of the signal that reaches the controller. The cover glass, electrode layout, nearby display electronics, and conditions at the touch surface all affect how much useful information the controller has to work with.
What changes beneath the glass
Capacitance describes how much electrical charge a structure can store for a given voltage. A small container is a useful analogy. For the same change in voltage, a larger capacitance requires more charge. At a fixed capacitance, the relationship is ΔQ = C × ΔV, where ΔQ is the change in charge, C is capacitance, and ΔV is the change in voltage.
In a touch panel, that “container” is formed by the electrodes, the conductors around them, and the insulating materials in between. Applying a voltage to an electrode redistributes charge and establishes an electric field. In a projected capacitive touch screen, often called PCAP, part of that field extends through the cover glass. A finger can interact with the field while the glass keeps it electrically insulated from the electrodes.
The controller applies a known electrical stimulus and measures the response. With the same voltage step, a change in capacitance changes the amount of charge moved during the measurement. The controller looks for a repeatable difference from the untouched state. At this point, it has an electrical reading. The position of the finger comes later.
One finger, two ways to measure its effect
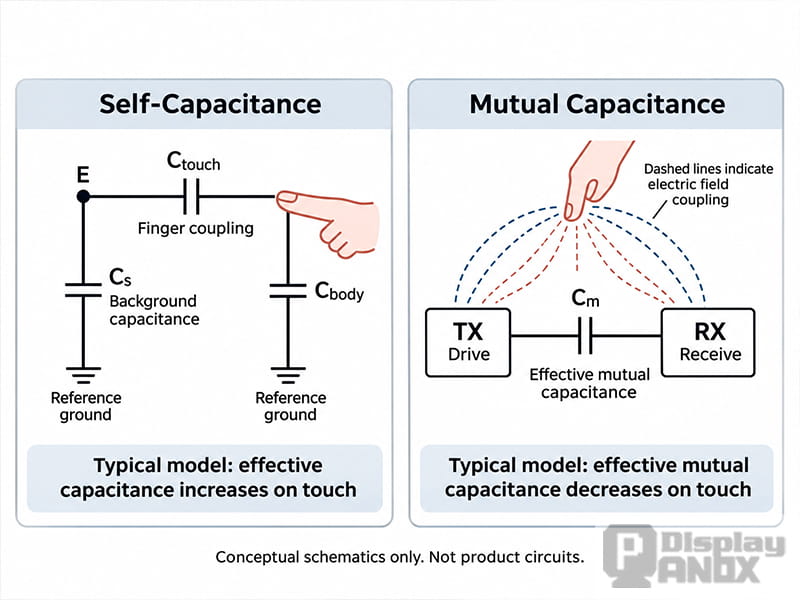
In self-capacitance sensing, the controller measures the effective capacitance of a single electrode relative to the circuit’s reference ground. The electrode has some background capacitance even when the screen is untouched. A finger adds another path through its coupling to the electrode and the body’s coupling to its surroundings. In a typical self-capacitance measurement, the added path increases the effective capacitance seen by the controller.
In mutual capacitance sensing, the measurement is between two electrodes. The transmit electrode, or TX, is driven with a known signal. The receive electrode, or RX, collects a response through the electric field that couples the pair. A nearby finger changes that field and introduces another path for the charge. In a common projected capacitive design, less charge reaches RX for the same TX drive, so the measured effective mutual capacitance falls. The size and direction of the change depend on the electrode geometry, grounding, and surroundings.
The two measurements can look very different in a drawing. A self-capacitance diagram often shows one electrode, its background capacitance, and the additional path through the finger and body. A mutual capacitance diagram usually shows a TX–RX pair and the electric field around it. Both relationships can exist in one electrode grid. Each electrode can couple to the circuit’s reference ground, and electrodes can couple to one another. A controller designed to use both measurements can scan them at different times and combine the results. Panox Display’s capacitive touch screen guide covers how these sensing methods fit into different panel constructions.
Making a faint signal readable
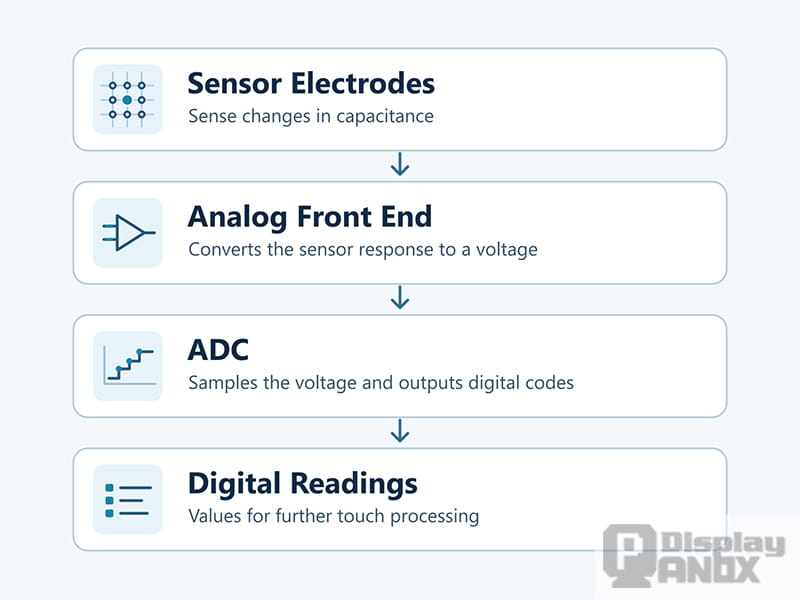
A finger changes only a small part of the electrical response. The sensor already has background capacitance, and the signal picked up by the electrodes can include interference from the display or nearby electronics. The analog front end (AFE) receives that response and conditions it for measurement. Its job is to keep the useful change visible while keeping the overall signal within the circuit’s measurement range.
Charge transfer is one way to do this. In a circuit that uses a feedback capacitor, timed switches control when the sensing capacitance is charged and when the resulting charge is transferred to the feedback capacitor. The transferred charge changes the voltage across that capacitor. A touch therefore shows up as a change in a voltage the circuit can measure. Depending on the design, the front end can adjust gain or compensate for part of the background signal so that the small change caused by the finger remains measurable.
In a voltage-based readout, an analog-to-digital converter (ADC) samples the conditioned voltage and produces a digital code. Some designs then demodulate the samples to recover the response associated with the drive signal. Another type of readout counts how many charge transfers are needed to reach a set voltage. These approaches give the controller a digital measurement it can compare across sensing points and over time.
This stage matters when a panel is integrated with a display. A sensor that gives clean readings on a bench can pick up more interference once the display is running beside it. The strength of the touch signal and the amount of interference both matter. If the touch response is already difficult to distinguish in the raw readings, the firmware has less information from which to estimate a stable position.
The map behind a tap
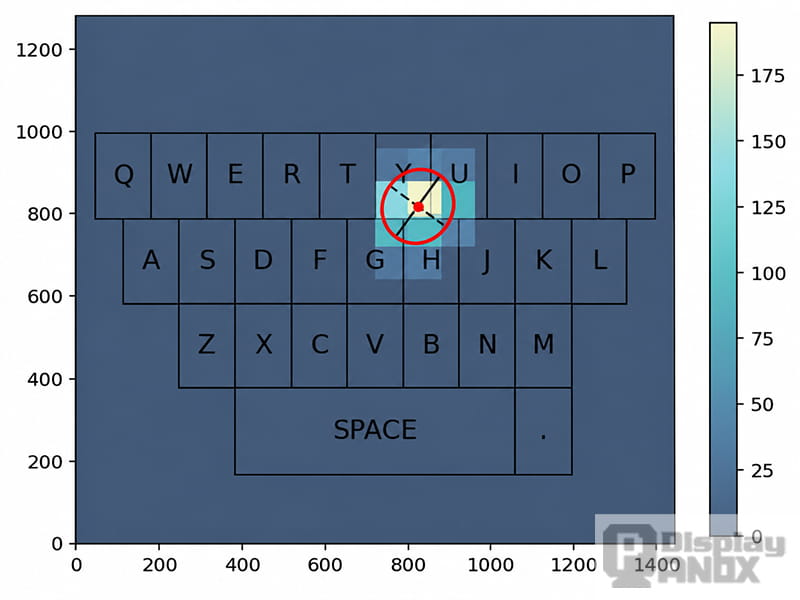
A single tap produces a cluster of responses across neighboring sensor nodes. The red ellipse approximates the contact area, and the red dot marks the estimated touch position.
A mutual capacitance scan can be arranged as a two-dimensional grid, with each reading associated with a TX–RX sensing node. A finger typically affects several neighboring nodes. Their readings form a rough map of the electrical change beneath the contact area. Self-capacitance measurements can be organized differently, such as a set of values for individual electrodes or electrode lines.
These readings are often called raw touch data. A raw value is usually a digital count that relates to capacitance, and it may never be converted to picofarads. The direction in which the count moves can also depend on how the controller encodes the measurement. To find the touch, the controller compares each reading with a baseline that represents the untouched panel, suppresses interference, and looks for a local pattern consistent with a finger.
A finger that lands between two sensing nodes can produce a stronger change at one node and a weaker change at the other. The controller can use their relative strengths, along with the readings from surrounding nodes, to estimate an X–Y position between them. The grid supplies the measurements, while the reported coordinate can fall anywhere between the sensing points.
The next scan shows whether the finger is still there and whether it has moved. A sequence of positions and contact states gives the host software enough information to distinguish a tap from a drag or swipe. Detection, coordinate calculation, and gesture recognition therefore happen at different stages. That distinction helps with troubleshooting. A weak pattern in the raw data points the investigation toward the sensor or readout. A clear pattern paired with a jumping coordinate gives the engineering team a reason to examine the filtering, position calculation, or tracking.
What changes when the panel goes into a product
The cover glass is part of the sensing system. A thicker lens can increase the distance between the finger and the electrodes, which may weaken the touch response. Gloves can reduce coupling further, and moisture on the glass can change the field in ways the controller has to interpret. For a machine interface that will be used with gloves, the relevant test is how the assembled unit responds with the intended glove, cover lens, and enclosure in place. A bare-finger test on the bench answers a different question.
The display and touch sensor can also use separate interfaces. The display receives image data, while the touch controller reports input back to the host. Panox Display’s 4.3-inch 800 × 480 TFT LCD with capacitive touch illustrates that distinction. It uses a two-lane MIPI interface for the image and a USB interface for the capacitive panel, which supports up to five touch points. The host design needs to account for both connections.
From a display sample to a fitted touch panel

1. Backlight Swtich
2. Usb touch Port 1
3. Usb touch Port 2
4. HDMI Display Port
The starting point depends on what the project needs to prove. For a Raspberry Pi interface prototype, a module with familiar connections makes it possible to evaluate the on-screen controls before the final enclosure is ready. Panox Display’s 7-inch Raspberry Pi touch display pairs a 1024 × 600 TFT LCD with HDMI for the picture and USB for touch input.
A compact handheld design may place more weight on the thickness of the display stack. The 7-inch PO070FMTO AMOLED module is a portrait MIPI display with on-cell touch, where the touch sensor is integrated on the display rather than supplied as a separate add-on panel. That construction is worth comparing when enclosure depth and cover-lens design are still open.
Projects with a fixed display size and a shaped cover lens often start with the mechanical drawing. It establishes the visible window, the touch area, and where the flexible cable can exit the enclosure. The host interface, expected touch count, and conditions at the glass then help narrow the controller and sensor options. Panox Display’s custom touch panel service brings those choices together for LCD and OLED projects that need a panel matched to the finished device.